R でポアソン回帰 - glm, MCMCpack
書籍 「 データ解析のための統計モデリング入門――一般化線形モデル・階層ベイズモデル・MCMC (確率と情報の科学) 」の 3章 「一般化線形モデル(GLM)」 と 9章 「GLMのベイズモデル化と事後分布の推定」 で説明されていたポアソン回帰を下記のような 3通りで試してみました。
- (1) GLM によるポアソン回帰 (glm 関数)
- (2) MCMCpack を使ったベイズ統計によるポアソン回帰1 (MCMCpoisson 関数)
- (3) MCMCpack を使ったベイズ統計によるポアソン回帰2 (MCMCmetrop1R 関数)
書籍では、R から WinBUGS を呼び出して MCMC サンプリングを行っていましたが、今回は R 上でベイズ統計解析を実施する MCMCpack パッケージを試してみました。
サンプルソースは http://github.com/fits/try_samples/tree/master/blog/20131215/
はじめに
まず、MCMCpack パッケージを使用するためにパッケージを R の実行環境へインストールしておきます。
MCMCpack のインストール
> install.packages("MCMCpack")
次に、ポアソン回帰を試すデータを書籍のサポート web サイトから取得してきます。
データ data3a.csv
y,x,f
6,8.31,C
6,9.44,C
6,9.5,C
12,9.07,C
10,10.16,C
・・・
ここで、データの内容は下記のようになっており、体サイズ x と肥料による施肥処理 f が種子数 y にどのように影響しているかをポアソン回帰で解析します。
| 項目 | 内容 |
|---|---|
| y | 種子数 |
| x | 植物の体サイズ |
| f | 施肥処理 |
(1) GLM によるポアソン回帰 (glm 関数)
それでは glm 関数を使ったポアソン回帰を試してみます。
ここでは stepAIC() を使った AIC によるモデル選択を試してみました。
poissonGlm.R
d <- read.csv('data3a.csv')

# 説明変数を全て投入したモデル (y ~ x + f と同じ)
d.all <- glm(y ~ ., data = d, family = poisson)

library(MASS)
# AIC によるモデル選択
d.res <- stepAIC(d.all)

summary(d.res)

png("poissonGlm.png")
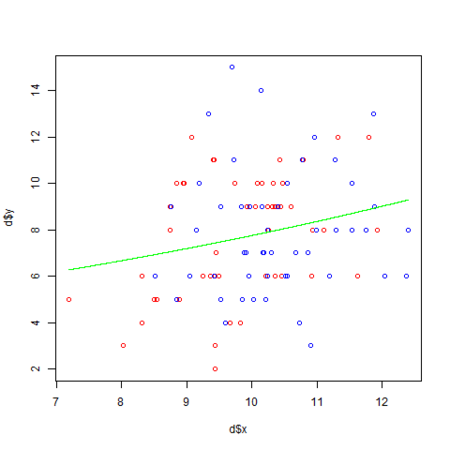
plot(d$x, d$y, col = c("red", "blue")[d$f])
xx <- seq(min(d$x), max(d$x), length = 1000)
# y ~ x のモデルを使った平均種子数の予測値の曲線を描画
lines(xx, exp(d.res$coefficients["(Intercept)"] + d.res$coefficients["x"] * xx), col="green")
# 以下でも可
#lines(xx, predict(d.res, newdata = data.frame(x = xx), type = "response"), col = "green")
dev.off()
なお、今回は y ~ x のモデルが選択される事 (施肥処理は効果が無い) を予め分かっているので、y ~ x のモデルを使って平均種子数の予測値を描画 (緑の線) しています。
ここで、 y ~ x モデルのリンク関数 (対数リンク関数) は で、平均種子数
は
となります。
また、 の最尤推定値が
d.res$coefficients["(Intercept)"]、 の最尤推定値が
d.res$coefficients["x"] に該当します。
実行
実行すると下記のような結果になります。
> R CMD BATCH poissonGlm.R
実行結果 poissonGlm.Rout
・・・
> d.res <- stepAIC(d.all)
Start:  AIC=476.59
y ~ x + f

       Df Deviance    AIC
- f     1   84.993 474.77
<none>      84.808 476.59
- x     1   89.475 479.25

Step:  AIC=474.77
y ~ x

       Df Deviance    AIC
<none>      84.993 474.77
- x     1   89.507 477.29
>
> summary(d.res)

Call:
glm(formula = y ~ x, family = poisson, data = d)

Deviance Residuals:
    Min       1Q   Median       3Q      Max
-2.3679  -0.7348  -0.1775   0.6987   2.3760

Coefficients:
            Estimate Std. Error z value Pr(>|z|)
(Intercept)  1.29172    0.36369   3.552 0.000383 ***
x            0.07566    0.03560   2.125 0.033580 *
---
Signif. codes:  0 '***' 0.001 '**' 0.01 '*' 0.05 '.' 0.1 ' ' 1

(Dispersion parameter for poisson family taken to be 1)

    Null deviance: 89.507  on 99  degrees of freedom
Residual deviance: 84.993  on 98  degrees of freedom
AIC: 474.77

Number of Fisher Scoring iterations: 4

・・・
この結果より、平均種子数の予測値を求める関数は になります。

(2) MCMCpack を使ったベイズ統計によるポアソン回帰1 (MCMCpoisson 関数)
MCMCpack でポアソン回帰を行うには MCMCpoisson 関数を使うのが簡単だと思います。 基本的に glm 関数と同様のモデル式とデータを指定するだけです。
ここでは y ~ x のモデルだけをポアソン回帰してみました。
なお、glm 関数では線形予測子のパラメータ と
の最尤推定値を取得しますが、MCMCpoisson 関数では
と
のそれぞれの分布を取得する点が大きく異なります。
poissonMcmcPoisson.R
library(MCMCpack)

d <- read.csv('data3a.csv')

d.res <- MCMCpoisson(y ~ x, data = d)

summary(d.res)

png("poissonMcmcPoisson.png")
plot(d$x, d$y, col = c("red", "blue")[d$f])
xx <- seq(min(d$x), max(d$x), length = 10000)
lines(xx, exp(mean(d.res[,1]) + mean(d.res[,2]) * xx), col="green")
dev.off()
glm の時とは異なり、 と
のそれぞれの算術平均値 (
mean の結果) を使って、平均種子数の予測値を描画 (緑の線) しています。
実行
実行すると下記のような結果になります。
> R CMD BATCH poissonMcmcPoisson.R
実行結果 poissonMcmcPoisson.Rout
・・・
> summary(d.res)

Iterations = 1001:11000
Thinning interval = 1
Number of chains = 1
Sample size per chain = 10000

1. Empirical mean and standard deviation for each variable,
   plus standard error of the mean:

               Mean     SD Naive SE Time-series SE
(Intercept) 1.29315 0.3602 0.003602       0.010757
x           0.07547 0.0352 0.000352       0.001047

2. Quantiles for each variable:

                2.5%     25%    50%     75%  97.5%
(Intercept) 0.586606 1.05208 1.2956 1.54153 1.9917
x           0.006025 0.05125 0.0756 0.09951 0.1438

・・・
Mean の値が glm の結果とほぼ同じ値になっています。

ちなみに、d.res には MCMC サンプリング結果として 1万個の と
の値が格納されています。
 の分布
の分布

 の分布
の分布

(3) MCMCpack を使ったベイズ統計によるポアソン回帰2 (MCMCmetrop1R 関数)
最後に MCMCmetrop1R 関数を使ってみます。
MCMCmetrop1R 関数では自前で定義した尤度関数を使って MCMC サンプリングを実施できるので汎用的に使えます。
今回のモデルの対数尤度は で、
なので、これらを関数化 (下記の
func) しています。
尤度関数が対数尤度か否かは logfun で指定するようになっており (TRUE の場合が対数尤度)、デフォルト値は TRUE となっています。 (今回は対数尤度なので logfun = TRUE です)
また、theta.init で と
の初期値を
c(0, 0) と指定しています。
poissonMcmcMetrop.R
library(MCMCpack)

d <- read.csv('data3a.csv')

# 尤度関数(対数尤度関数)
func <- function(beta, x, y) {
  lambda <- exp(beta[1] + beta[2] * x)
  sum(log(dpois(y, lambda)))
}

d.res <- MCMCmetrop1R(func, theta.init = c(0, 0), x = d$x, y = d$y, logfun = TRUE)
# 下記でも同じ
#d.res <- MCMCmetrop1R(func, theta.init = c(0, 0), x = d$x, y = d$y)

summary(d.res)

png("poissonMcmcMetrop.png")
plot(d$x, d$y, col = c("red", "blue")[d$f])
xx <- seq(min(d$x), max(d$x), length = 10000)
lines(xx, exp(mean(d.res[,1]) + mean(d.res[,2]) * xx), col="green")
dev.off()
実行
実行すると下記のような結果になります。
> R CMD BATCH poissonMcmcMetrop.R
実行結果 poissonMcmcMetrop.Rout
・・・
> summary(d.res)

Iterations = 501:20500
Thinning interval = 1
Number of chains = 1
Sample size per chain = 20000

1. Empirical mean and standard deviation for each variable,
   plus standard error of the mean:

        Mean      SD  Naive SE Time-series SE
[1,] 1.29545 0.35797 0.0025313      0.0077477
[2,] 0.07528 0.03498 0.0002473      0.0007561

2. Quantiles for each variable:

         2.5%     25%     50%     75%  97.5%
var1 0.584646 1.05368 1.29884 1.53850 1.9830
var2 0.007798 0.05159 0.07518 0.09907 0.1448

・・・
glm や MCMCpoisson と似たような結果となりました。

なお、MCMCpoisson と MCMCmetrop1R ではバーンイン burnin とサンプリング数 mcmc のデフォルト値が異なっています。
| 関数 | burnin のデフォルト値 | mcmc のデフォルト値 |
|---|---|---|
| MCMCpoisson | 1000 | 10000 |
| MCMCmetrop1R | 500 | 20000 |
